
 Let’s face it, GIS is a term loosely (if even that) understood by the public. Without a university degree in Geography or certificate in GIS, web-mapping enables users to explore geospatial data, patterns and phenomenon quite effectively. As an exploratory tool, web-mapping bridges the gap between the analytical engine that is the GIS software, and the basic static map.
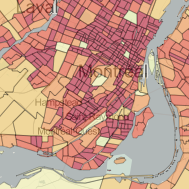
This web mapping application was created by Michael Markieta and presented to Ryerson University in partial fulfillment for the requirements of Professional Geographer (GEO871), a capstone course of the Geographic Analysis program. It is an interactive web-based mapping tool that provides users with access to a geovisual representation of the Canadian 2011 Census of the Population. This research project utilizes the Leaflet JavaScript library to produce an interactive web-mapping tool, which aims to visualize the recently released Statistics Canada 2011 Census of the Population. The data is hosted in an open-source cloud-based geospatial database, CartoDB, which serves our data storage and retrieval needs. CartoDB is based on the PostgreSQL database and spatial extension PostGIS, which utilizes SQL and a variety of other tools. The jQuery JavaScript library provides the interactivity between the user and map environments.