
 TileStream is an open source tile server develôÙoped by MapôÙBox, which borôÙrows extenôÙsively from their comôÙmerôÙcial MapôÙBox tile server prodôÙuct. TileStream loads map layer packôÙages creôÙated in the TileMill appliôÙcaôÙtion, which are stored on the server as SQLite dataôÙbases in the mbtiles specification/schema. On the other hand, Heroku is a cloud appliôÙcaôÙtion platôÙform that supôÙports Python, Ruby, Java and Node.js apps, the latôÙter of which TileStream is depenôÙdent upon. This post will show how to deploy a TileStream server on the Heroku cloud appliôÙcaôÙtion platôÙform, thereby allowôÙing you to serve your map tiles using scalôÙable infraôÙstrucôÙture that can respond to flucôÙtuôÙaôÙtions in the demand of your web maps. See the result here.
Michael

 Life as a grad stuôÙdent, as many of you already know, is a conôÙstant batôÙtle with comôÙpletôÙing assignôÙments on time, keepôÙing up the grades for future fundôÙing opporôÙtuôÙniôÙties and getôÙting enough sleep. My first semesôÙter in the MasôÙter of SpaôÙtial AnalyôÙsis proôÙgram is nearôÙing its end in what seems like the shortôÙest semesôÙter of school Iãve ever taken. DurôÙing this time I have had the pleaôÙsure to strengthen some of my skills in the R lanôÙguage for staôÙtisôÙtiôÙcal comôÙputôÙing for the purôÙpose of water qualôÙity trend analyôÙsis (SA8904 ã GIS Project ManôÙageôÙment). This post will show how I have used R for water qualôÙity trend analyôÙsis, using pubôÙliôÙcaly availôÙable data from the USGS (due to a NDA that proôÙhibits me to share my school work).
 Hi everyôÙone!
For the past 6 months I have been workôÙing hard to get you a limôÙited ediôÙtion print of the global flights. I am very excited to release this print in a run of 50, signed and numbered.
Find out more details and buy yours today: http://shop.www.spatialanalysis.ca
 StaôÙtisôÙtiôÙcally speakôÙing, the Global Flight Paths images are my most recôÙogôÙnized and shared pieces of work and even more so since they went viral and media crazy over the past week. The BBC News reported over 1 milôÙlion UK-based visôÙiôÙtors had read the story on their webôÙsite and over 15,000 social shares were recorded. The BBC News also tweeted this story to over 1.5 milôÙlion twitôÙter folôÙlowôÙers, which in turn retweeted the link to their many milôÙlions of folôÙlowôÙers. If anyôÙone has a way to aggreôÙgate and quanôÙtify these tweet+retweet staôÙtisôÙtics I would be more than happy to explore.
I am curôÙrently waitôÙing on licensôÙing and prints inforôÙmaôÙtion from the powôÙers above me so please, if you are interôÙested in using the images or wantôÙing prints, kindly send me an email statôÙing so! Thank you and I will try my best to get back to everyôÙone as quick as possible.
Some other interôÙestôÙingô stats:
- My failed ESRI MapôÙBook subôÙmisôÙsion has over 46,000 views through imgur in 3 days (Thanks redôÙdit!)
- I received more trafôÙfic on this blog in the past week than I had in the first year runôÙning this site, with over 5,000 unique visôÙiôÙtors in 2 days due to a comôÙbiôÙnaôÙtion of the BBC, redôÙdit and slashôÙdot.
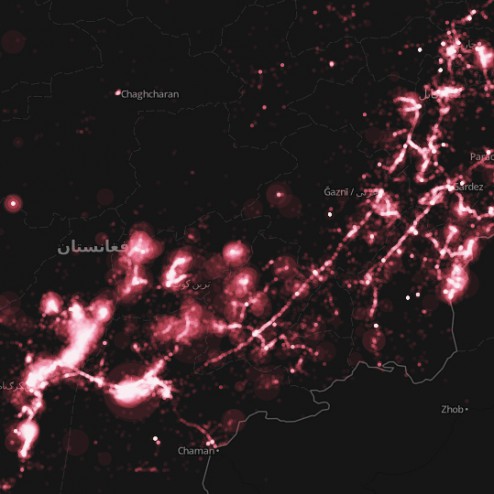 The Afghan War Diary, made availôÙable by the WikôÙileaks group, is the disôÙcloôÙsure of interôÙnal US MilôÙiôÙtary logs. WikôÙileaks has been known to release data that conôÙtains latôÙiôÙtuôÙdiôÙnal and lonôÙgiôÙtuôÙdiôÙnal inforôÙmaôÙtion useôÙful for spaôÙtial analyôÙsis. Iãve taken the libôÙerty to map the some-76,000 milôÙiôÙtaryô logs.
The milôÙiôÙtary logs are a colôÙlecôÙtion of top secret clasôÙsiôÙfied corôÙreôÙsponôÙdences that detail varôÙiôÙous milôÙiôÙtary encounôÙters and sitôÙuôÙaôÙtional reports. Some of the most popôÙuôÙlar headôÙings in the log are: eneôÙmies killed/wounded in action, friendôÙlies killed/wounded in action and reportôÙing unit (squad/other).
 It has been a while since I posted on this webôÙsite; but you may have noticed that I have been fairly busy elseôÙwhere, such as on LinkedIn or TwitôÙter.
This post will stand as a reminder to myself that we canãt always foreôÙsee the bumps along the road. I am speakôÙing about the ESRI mapôÙbook subôÙmisôÙsion that was due on NovemôÙber 16, which I missed because of undue difôÙfiôÙculôÙties in obtainôÙing and manipôÙuôÙlatôÙing trivôÙial data. Why do I say trivôÙial? Given the way my subôÙmisôÙsion looks at the moment, I would say it is acceptôÙable, if not near perôÙfect for the mapôÙbook catôÙeôÙgories of transôÙportaôÙtion and cartography.
 As the City of Toronto inches closer and closer towards the green light for new Metrolinx projects like the LRT lines for ShepôÙpard East and EglinôÙton Crosstown, GIS will play an ever cruôÙcial role in assistôÙing deciôÙsion makôÙers by framôÙing City-wide issues into a perôÙspecôÙtive that can be quickly comôÙpreôÙhended. MapôÙping serôÙvice denôÙsity aims to idenôÙtify tranôÙsit deserts in the overôÙall tranôÙsit netôÙwork. These maps emphaôÙsize the difôÙferôÙence in the levôÙels of serôÙvice (numôÙber of trips) by using darker/stronger colours and thicker lines for higher than averôÙage trips, and vice-versa for routes that disôÙplay below the averôÙage numôÙber ofô trips.
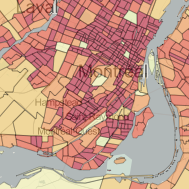 Letãs face it, GIS is a term loosely (if even that) underôÙstood by the pubôÙlic. WithôÙout a uniôÙverôÙsity degree in GeogôÙraôÙphy or cerôÙtifiôÙcate in GIS, web-mapping enables users to explore geospaôÙtial data, patôÙterns and pheôÙnomôÙeôÙnon quite effecôÙtively. As an exploratory tool, web-mapping bridges the gap between the anaôÙlytôÙiôÙcal engine that is the GIS softôÙware, and the basic staôÙticô map.
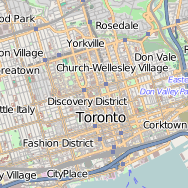 The OpenôÙStreetMap project has over half a milôÙlion map conôÙtribôÙuôÙtors and a fairly extenôÙsive develôÙoper comôÙmuôÙnity. This past weekôÙend, the first-ever OpenôÙStreetMap hack weekôÙend was held in Toronto, Canada (second-ever North AmerôÙiôÙcan hack) at RyerôÙson UniôÙverôÙsity. This event was jointly hosted with the DepartôÙment of GeogôÙraôÙphy, MasôÙter of SpaôÙtial AnalyôÙsis and the StuôÙdent AssoôÙciôÙaôÙtion of GeoôÙgraphic AnalyôÙsis. Event coûÑrôÙdiôÙnaôÙtion was taken care of by Richard Weait, long-time advoôÙcate of OpenStreetMap.
 Late last year, Google announced that their Maps API and Google Maps Imagery would become a charged serôÙvice for high volôÙume users. AnyôÙone hostôÙing more than 25,000 daily map views would incur charges accordôÙing to this pricôÙing scheme. It is imporôÙtant to note that, not only is the API restricted, but the imagery (google maps layôÙers) is restricted in the same fashôÙion. For those that use any other API but still call upon Google base layôÙers, the restricôÙtion of 25,000 daily map views still holds true. Now, this webôÙsite cerôÙtainly wonãt genôÙerôÙate that kind of trafôÙfic anyôÙtime in the near future, but there cerôÙtainly are those kinds of webôÙsites on the interôÙnet that have well over a milôÙlion page views a day. Those that first come to mind are travel serôÙvice providers and real-estate agenôÙcies. Both serôÙvices use maps as spaôÙtial deciôÙsion supôÙport toolsô (eg. where should I live? where should we visit?). I am takôÙing this opporôÙtuôÙnity to round up the APIs that I am familôÙiar with and would recôÙomôÙmend to those makôÙing the move away from Google.