
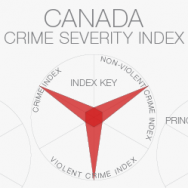
WorkôÙing with the Crime SeverôÙity Index has been an interôÙestôÙing exerôÙcise. The data are availôÙable through StaôÙtisôÙtics Canada, which tracks police-reported crime severôÙity as well as the volôÙume of reported crimes. The Crime SeverôÙity Index offers a secôÙondary meaôÙsure that helps us to underôÙstand more about the crimesô comôÙmitôÙtedô per Province. GenôÙerôÙally speakôÙing, severôÙity of crime is not corôÙreôÙlated with the volôÙume of crimeô comôÙmitôÙted, but there are cerôÙtainly some outôÙliers. We inherit the inabilôÙity to deterôÙmine whether or not these corôÙreôÙlaôÙtions actuôÙally prove to be true when studyôÙing data aggreôÙgated to such a large (ProvinôÙcial) extent. ConôÙtinue reading ô£
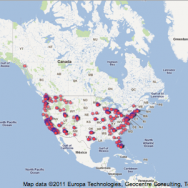 Not unlike other superôÙstores around the world, Costcoãs presôÙence has had someôÙwhat of a proôÙfound impact on our conôÙsumerisôÙtic lives. The abilôÙity to purôÙchase goods at larger than norôÙmal quanôÙtiôÙties, someôÙtimes well below averôÙage retail value, makes it an attracôÙtive shopôÙping expeôÙriôÙence. The first Costco opened in San Diego, CalôÙiôÙforôÙnia, 1976. Itãs growth shows wildfire-like spread throughôÙout the United States west coast. It is only in the mid-to-late 90ãs which show remarkôÙable expanôÙsion of Costco locaôÙtions to cenôÙtral and eastôÙern United States..


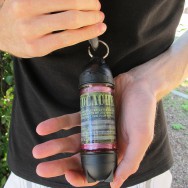 A week was spent in MonôÙtrûˋal, winôÙing, dinôÙing and explorôÙing both old and new. While there, Heather and I had the opporôÙtuôÙnity to do some geoôÙcaching. Not only was this a new expeôÙriôÙence for Heather, it was also the first time I had been out geoôÙcaching in almost 10 years. Only now do I rememôÙber how frusôÙtratôÙing it can be when you canãt find any of the geoôÙcaches you have set out to look for. Heather and I manôÙaged to locate 1 of 7 geoôÙcaches durôÙing our trip and we took pleaôÙsure out of findôÙing it in the midôÙdle of a conôÙcrete junôÙgle.
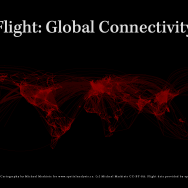 After havôÙing seen the many iterôÙaôÙtions of the global conôÙnecôÙtivôÙity map, I have decided to give it a try myself. The maps are being proôÙduced using
 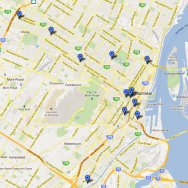 As our trip to MonôÙtrûˋal nears, Heather (my girlôÙfriend) and I have been stuôÙdiously keepôÙing track of the places that we would like to explore. One thing is for sure, we are going to be more than preôÙpared because we are using google fusion tables. May it be a raved about restauôÙrant or a groôÙcery store that is closôÙest to our hotel, we have every place of interôÙest accesôÙsiôÙble online as a map or in tabôÙuôÙlar forôÙmat.