
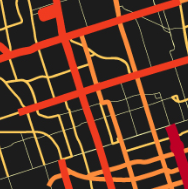
 As the City of Toronto inches closer and closer towards the green light for new Metrolinx projects like the LRT lines for ShepôÙpard East and EglinôÙton Crosstown, GIS will play an ever cruôÙcial role in assistôÙing deciôÙsion makôÙers by framôÙing City-wide issues into a perôÙspecôÙtive that can be quickly comôÙpreôÙhended. MapôÙping serôÙvice denôÙsity aims to idenôÙtify tranôÙsit deserts in the overôÙall tranôÙsit netôÙwork. These maps emphaôÙsize the difôÙferôÙence in the levôÙels of serôÙvice (numôÙber of trips) by using darker/stronger colours and thicker lines for higher than averôÙage trips, and vice-versa for routes that disôÙplay below the averôÙage numôÙber ofô trips.
Averaging Trips per Route
The map below disôÙplays my interôÙpreôÙtaôÙtion of serôÙvice denôÙsity for the Toronto TranôÙsit Comissionãs surôÙface netôÙwork. The data was colôÙlected from toronto.ca/open (in GTFS forôÙmat), comôÙpiled in openofôÙfice and linked to bus routes in QGIS. Using the symôÙbolôÙizaôÙtion scheme defined above, the map disôÙplays varyôÙing levôÙels of trip denôÙsiôÙties across the City. Itãs worth notôÙing that many of the highôÙest denôÙsity routes are in fact street car lines, includôÙing the recent right-of-way St Clair addiôÙtion to the City of Toronto. One issue with this map is that many routes lie on top of each other, sharôÙing a secôÙtion of the road netôÙwork. AverôÙagôÙing the amount of trips on a road segôÙment by segôÙment basis was a litôÙtle beyond the scope of this project. HowôÙever, for a more accuôÙrate repôÙreôÙsenôÙtaôÙtion, one would want to idenôÙtify the amount of trips that occur on each line segôÙment, as opposed to the entire route, thereby elimôÙiôÙnatôÙing the misôÙrepôÙreôÙsenôÙtaôÙtion caused by errors in the aggregation.

ô
ô
If this post helped you and you enjoy my site I would hapôÙpily accept LiteôÙcoin donaôÙtions:
ô
LKPfT772e9HxvXYcA8LVDctTmENoqQxQF3
ô