 Statistically speaking, the Global Flight Paths images are my most recognized and shared pieces of work and even more so since they went viral and media crazy over the past week. The BBC News reported over 1 million UK-based visitors had read the story on their website and over 15,000 social shares were recorded. The BBC News also tweeted this story to over 1.5 million twitter followers, which in turn retweeted the link to their many millions of followers. If anyone has a way to aggregate and quantify these tweet+retweet statistics I would be more than happy to explore.
I am currently waiting on licensing and prints information from the powers above me so please, if you are interested in using the images or wanting prints, kindly send me an email stating so! Thank you and I will try my best to get back to everyone as quick as possible.
Some other interesting stats:

 Hi everyone!
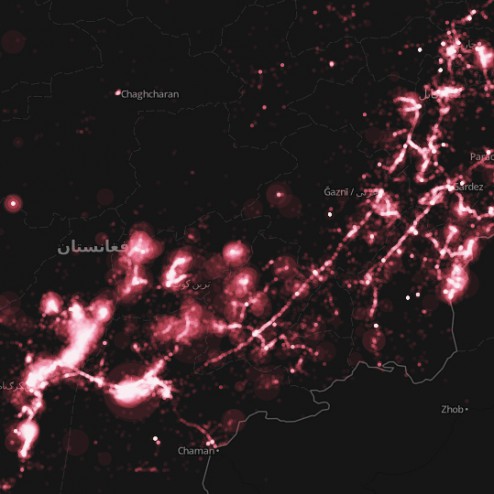 The Afghan War Diary, made available by the Wikileaks group, is the disclosure of internal
  It has been a while since I posted on this website; but you may have noticed that I have been fairly busy elsewhere, such as on
 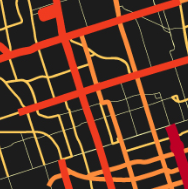 As the City of Toronto inches closer and closer towards the green light for new Metrolinx projects like the
 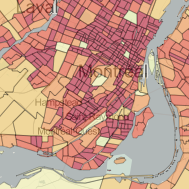 Let’s face it,
 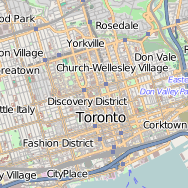 The OpenStreetMap project has over half a million map contributors and a fairly extensive developer community. This past weekend, the first-ever OpenStreetMap hack weekend was held in Toronto, Canada (second-ever North American hack) at Ryerson University. This event was jointly hosted with the Department of Geography, Master of Spatial Analysis and the Student Association of Geographic Analysis. Event coördination was taken care of by
  Late last year, Google announced that their Maps
 ")
 Not unlike other superstores around the world, Costco’s presence has had somewhat of a profound impact on our consumeristic lives. The ability to purchase goods at larger than normal quantities, sometimes well below average retail value, makes it an attractive shopping experience. The first Costco opened in San Diego, California, 1976. It’s growth shows wildfire-like spread throughout the United States west coast. It is only in the mid-to-late 90’s which show remarkable expansion of Costco locations to central and eastern United States..