
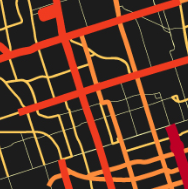
 As the City of Toronto inches closer and closer towards the green light for new Metrolinx projects like the LRT lines for Sheppard East and Eglinton Crosstown, GIS will play an ever crucial role in assisting decision makers by framing City-wide issues into a perspective that can be quickly comprehended. Mapping service density aims to identify transit deserts in the overall transit network. These maps emphasize the difference in the levels of service (number of trips) by using darker/stronger colours and thicker lines for higher than average trips, and vice-versa for routes that display below the average number of trips.
Apr 262012
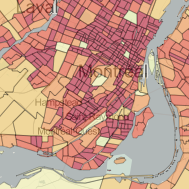 Let’s face it, GIS is a term loosely (if even that) understood by the public. Without a university degree in Geography or certificate in GIS, web-mapping enables users to explore geospatial data, patterns and phenomenon quite effectively. As an exploratory tool, web-mapping bridges the gap between the analytical engine that is the GIS software, and the basic static map.